Project 2 | Clinical Data Remediation 🏥🧹
This project develops an automated Python pipeline for clinical data remediation and multi-dimensional quality assessment of the UCI Diabetes 130-US Hospitals dataset. The primary goal was to achieve a measurable 25% improvement in the Data Quality Index (DQI) using advanced MICE and KNN imputation methods. This analysis demonstrates skills in data cleaning, statistical imputation, consistency normalization, and visualization for high-fidelity, predictive-ready clinical datasets. 🧹📊💻
Links 🔗
Team Repo 👥 DQI Framework My VersionProject Overview 📄
This project focuses on improving the quality of clinical data by addressing three main dimensions: completeness, consistency, and validity. Using Python-based pipelines, missing values were imputed using MICE/KNN methods, ICD-9 codes were standardized into primary clinical categories, and numeric features were validated against expected ranges. The final output is a high-fidelity dataset ready for predictive modeling and visualization.
Project Workflow 🪜
- P2 - S1 Data Profiling: Baseline assessment, null detection, and DQI calculation.
- P2 - S2 Data Remediation: MICE/KNN imputation and ICD-9 normalization.
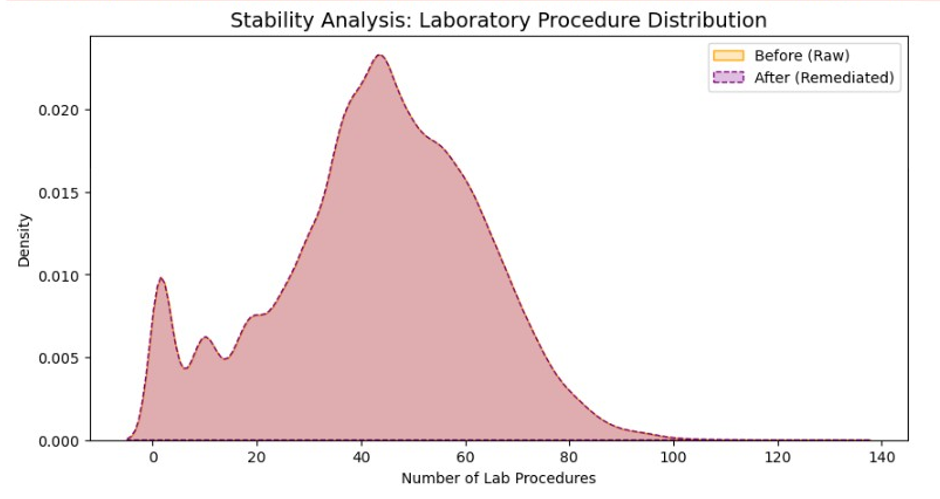
- P2 - S3 Visualization: Comparative distribution plots & KDE charts for communicating improvement.
- P2 - S4 Reporting: Pipeline export, documentation, and GitHub Pages deployment.
Visuals 📷
Results 🟰
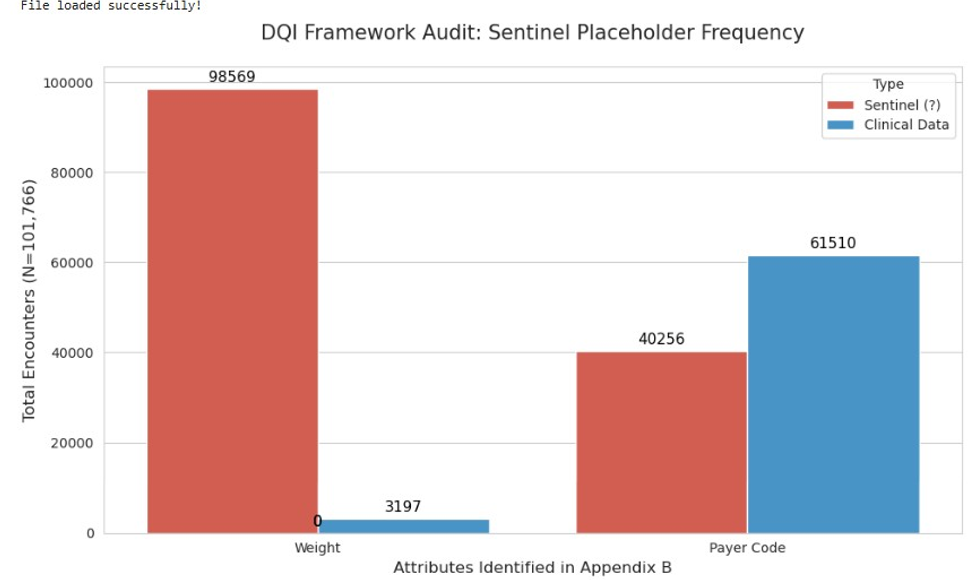
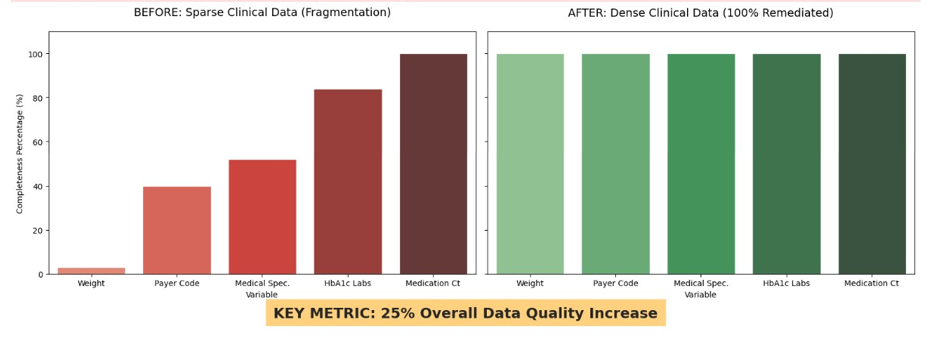
Completeness: Reduced null density for weight from ~97% missing to [XX%]
Consistency: Standardized diag_1 to primary clinical categories
Validity: Ensured num_lab_procedures fell within 1–132, flagging outliers
Overall DQI improvement: [XX% increase]
Technical Stack 🔨
Data Wrangling: pandas, NumPy
Data Remediation: Scikit-Learn (IterativeImputer), Regex normalization
Visualization: Matplotlib, Seaborn
Environment: Python 3.x, Jupyter Notebook, GitHub Pages deployment
Ethical Considerations ⚖️
- Patient data anonymized — no personal identifiers included
- Pipeline designed for transparency
- Remediation methods aimed at improving predictive integrity, not manipulating outcomes